2026 taxable assessment $236,840 × 1.3998%. Estimate—not a bill or account balance.
OPA also publishes a 2027 assessment of $1,212,400; it is not the 2026 billed-year value.
House report
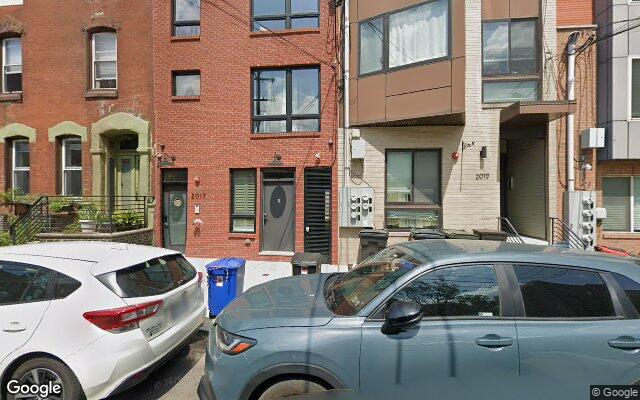
7 bd · 5 ba · 3 stories · 5,913 sqft · RM1 · built 2021
Absentee individual · assessed $1.2M (2026) · 2027 OPA assessment $1.2M · sold 5×. On the 2000 block of E Susquehanna Ave.
“Open” reflects records available then historical records keep their source dates estimates are labeled
These curated questions are free. Choose one to open its cited answer.
BlockReport can explain a discrepancy, but it cannot rewrite an official City record. Use the agency that owns the underlying fact:
Property tax
BlockReport can calculate the annual tax from the City’s taxable assessment. Payments, credits, interest, and a current amount due live separately in Philadelphia Tax Center.
2026 taxable assessment $236,840 × 1.3998%. Estimate—not a bill or account balance.
OPA also publishes a 2027 assessment of $1,212,400; it is not the 2026 billed-year value.
A Tax Center balance is net of bills, payments, credits, interest, and adjustments. A credit—or an amount due—is not automatically “back taxes.”
OPA 3130376002026 OPA taxes $236,840 of $1,184,200 assessed. The assessment fields alone do not identify a program, approval date, expiration, or buyer eligibility.
See the assessment math →Applying the same rate to the billed-year full assessment. OPA's numeric split does not say when or whether the current treatment changes.
See the assessment math →The June 2022 delinquency snapshot was not verifiably available in this cached report. No conclusion about a match—or today’s balance—can be drawn from that absence.
For a purchase, refinance, or closing, request the City’s official Property Payoff statement in Tax Center under “More options.”
Old house bought for $2K in 2007, demolished in 2019 and rebuilt (2020), then sold for $1.3M in 2021.
View supporting records →Legal due diligence
These checks are triggered by this property’s actual City rows. They identify the controlling document to verify; they do not declare a use legal, a building safe, or title clear.
Why it mattersIf dwelling space is rented, the buyer must obtain a new annual Rental License; the seller’s license is not transferable. New applications require proof of ownership and legal occupancy, tax compliance, no open L&I violations, and lead compliance where applicable.
Verify nextPlan the buyer’s replacement license before settlement.
Open the controlling City guidance ↗Why it mattersThe numeric treatment can reflect an improvement abatement or another exemption. It does not identify the ordinance, approval, start or end date, or continuation requirements after a transfer. Once OPA verifies a specific active abatement, many common programs attach the benefit to the property for the remaining term rather than ending automatically at sale, but some require a new-owner filing and continued qualifying use or tax compliance.
Verify nextObtain the OPA exemption/abatement determination and history, then underwrite the buyer’s bill from the verified program terms.
Open the controlling City guidance ↗The seller must obtain Philadelphia’s certificate showing the base zoning, last use in the zoning record, and open violations. The City warns that it does not prove Building Code occupancy or show zoning overlays.
Next: Obtain the fresh certificate and compare it with the CO, permits, and Atlas overlays.
Official guidance ↗The Tax Center Property Payoff covers Real Estate Tax, Commercial Trash, and L&I abatement-work invoices. Philadelphia says it does not include business-tax debts or liens, water and sewer charges, or fines for code violations.
Next: Request the City statement effective through settlement; read every period and invoice.
Official guidance ↗OPA ownership, deed summaries, and a zero tax balance are not clear title. Mortgages, judgments, municipal claims, water liens, easements, heirs, and other encumbrances require separate searches.
Next: Use a Pennsylvania lawyer/title company and obtain owner’s title insurance; order the separate water search/payoff.
Official guidance ↗Separate water-lien guidance ↗LOOP and low-income or senior Real Estate Tax freezes depend on the qualifying owner and continued program eligibility; a buyer cannot assume the seller’s capped or frozen bill continues. A separately verified property abatement often remains with the property for its remaining term, but program-specific new-owner filing, use, and tax-compliance conditions still must be confirmed—not inferred from the reduced assessment alone.
Next: Have Revenue or OPA identify every current benefit, model the buyer’s bill without seller-specific relief, and confirm any verified abatement in writing.
Official guidance ↗Separate water-lien guidance ↗For a covered Pennsylvania residential transfer, obtain the statutory seller disclosure. It reports the seller’s knowledge; it is not a warranty, title search, code review, or substitute for inspections.
Next: Have the agreement and disclosure reviewed for this transaction’s coverage and exceptions.
Official guidance ↗Informational only—not a legal opinion, title report, code inspection, tax payoff, or substitute for a Pennsylvania lawyer, title company, inspector, or tax professional.
Rule-based groupings across this property's dated public records. Each flag shows the records that belong in the same verification step and where the inference stops.
The assessment jumped 495% in 2023, but no matching permit appears in the property timeline.
Evidence: assessment moved from $218,600 to $1,300,000 · no permit shown in 2022-2024
Limit: Not proof of unpermitted work; reassessment, corrected data, or a permit under another parcel can also explain it.
Transparent record rules, not a score or forecast. Each flag is a prompt to verify the cited records, not a prediction or allegation.
The record, translated into moves — what a buyer, the owner, and a landlord would each want to check next under Philadelphia's actual rules.
The 2026 taxable assessment implies about $3,315/yr, while applying the same rate to the full assessment would imply about $16,576/yr — $13,261/yr more. OPA's assessment split does not establish the exemption program, expiration, or buyer eligibility. Verify the basis and live bill with OPA and Revenue.
Renewal requires city tax clearance and zero open L&I violations on the property. A lapsed license suspends the right to collect rent or evict.
Derived from the fetched property records and linked City guidance as of 2026. Assessment treatment is not a substitute for an exemption approval, live balance, title report, license, occupancy certificate, or inspection. Informational only — not legal, tax, or investment advice.
How this house has moved and where it's pointed: the city's assessed value (not a listing price) over 12 years, charted against its block; appreciation is that history's pace, and the 5-year figure simply extends it. Yield estimates rent-vs-price from area rents. Ask the record to dig into any number.
Value vs. the block, over time — sales, permits & L&I events marked on the line
Old house bought for $2K in 2007, demolished in 2019 and rebuilt (2020), then sold for $1.3M in 2021.
Flags: material assessment exemption — legal basis and term unverified · active rental license. Informational only — not investment advice or a consumer report (FCRA).
OPA's 2026 taxable assessment implies about $3,315/year. Applying the same 1.3998% rate to the full assessed value would imply ~$16,576/year — $13,261/year more. That is a scenario, not a forecast: the assessment split alone does not identify the exemption program, approval date, expiration, transfer treatment, or live Tax Center balance.
2026: ($1,184,200 assessed − $947,380 exempt) × 1.3998% ≈ $3,315/yr
full-assessment scenario: $1,184,200 × 1.3998% ≈ $16,576/yr
The OPA amount does not prove a ten-year abatement or any other specific program. Obtain the approval history and verify the current Tax Center account; a buyer should not assume the seller's relief transfers or restarts.
The city assessor's field record — the physical spec sheet behind the assessed number.
OPA field-assessment attributes. Condition and grade are the assessor's codes, not an inspection.
What owning 2017 E Susquehanna Ave takes, at your price and your rate. Taxes start with an annual estimate from the City’s taxable assessment, not a current bill or balance; rent starts at the area median. Assessed value is not an asking price — set the price slider to the real one.
When this house last sold (2021) a 30-year mortgage ran about 2.96% — Freddie Mac's average that year.
Estimates for orientation, not advice. Assumes a 30-year fixed loan, $1,400/yr insurance, 1% of price/yr maintenance; taxes use this parcel's taxable assessment with an optional full-assessment stress test, not a live Tax Center balance.
2017 E Susquehanna Ave sits on the 2000 block of E Susquehanna Ave. Open the block report to compare its parcels, ownership and public-record history.
See the whole block →Next door: 2015 E Susquehanna Ave · 2019 E Susquehanna Ave
This report was assembled Jul 8, 2026, 5:08 PM ET. Available City datasets are queried from OpenDataPhilly (phl.carto.com) and the cited City ArcGIS feeds; record queries paginate rather than silently taking a first page. “Unavailable” means the source query failed or was not supplied, not “no record.” Reports re-pull on view after seven days and on an overnight rolling schedule; citywide benchmarks recompute weekly. Source dates still govern: the parcel-level tax-delinquency snapshot is June 2022 and the separate detailed tax ledger ends in 2016, so neither establishes today’s balance. The live balance and date-effective payoff must be verified in Tax Center. AI-written passages are grounded in the assembled record and rejected if they state a number the record does not hold.
Official city record ↗ · L&I history ↗ · See the whole block · Download this record (JSON)